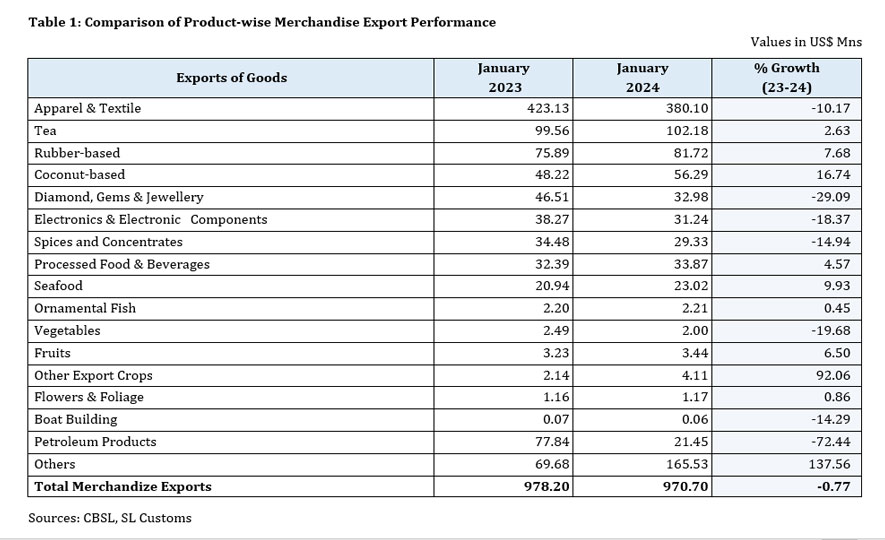
The merchandise export performance in January 2024 amounted to US$ 970.7 million, recorded a 0.77 % decline compared to January 2023.
Compared to January 2023, agricultural exports shown a modest increase of 3.58%, reaching US$ 225.43 million in January 2024. However, industrial exports experienced a decline of 2.08% during the same period, dropping to US$ 744.77 million.
Major Exports in January 2024
a) Products with Positive Growth (Increases)
Export earnings from tea which made up 12% of merchandise exports, increased by 2.63 % y-o-y to US$ 102.18 Mn in January 2024 compared to January 2023. This increase is mainly due to the strong performance in the export of Bulk Tea, Tea Bags and Green Tea, increased by 8.9 % and 58.33% and 89.29% respectively.
Furthermore, volume of tea exports increased by 6.88 % in January 2024 compared to January 2023. Additionally, Tea exports to Iran and Iraq markets, increased by 93.81% and 35.11% respectively.
Moreover, Export earnings from Rubber and Rubber Finished products have increased by 7.68 % y-o-y to US$ 81.72 Mn in January 2024, with the strong performance in exports of Pneumatic & Retreated Rubber Tyres & Tubes (17.57%). Furthermore, exports of rubber to Italy and Canada experienced significant growth, surpassing 100% in January 2024 compared to January 2023.
On monthly analysis, export earnings of Coconut based products increased by 16.74 % in January 2024 compared to January 2023. Moreover, export earnings of Coconut kernel products and Coconut shell products increased by 19.92 % and 42.68 % respectively in January 2024 compared to January 2023.
Export earnings from Coconut Oil, Coconut Cream and Liquid Coconut Milk which are categorized under the Coconut kernel products increased by 39.74 %, 37.5 % and 15.01 % respectively in January 2024 compared to January 2023.
Being the largest contributor to Coconut based sector, Coco Peat, Fiber Pith & Moulded products which are categorized under the Coconut fibre products, increased by 0.57% to US$ 10.55 Mn in January 2024 in comparison to January 2023.
Earnings from Activated Carbon, which is categorized under the Coconut shell products increased by 44.07 % to US$ 12.88 Mn in January 2024 compared to January 2023.
Export earnings from Seafood increased by 9.93 % to US$ 23.02 Mn in January 2024 compared to January 2023.This increase was mainly due to the strong performance in export of Fresh fish (30.8 %) and Shrimps (44.83 %). Furthermore, export earnings from Ornamental fish increased by 0.45% to US$ 2.21 Mn in January 2024 compared to January 2023.
Export earnings from Food & Beverages have increased by 4.57 % y-o-y to US$ 33.87 Million in January 2024, with the positive performance in exports of Processed food (124.73%).
b) Products with Negative Growth (Decreases)
Export earnings from Apparel & Textile decreased by 10.17 % y-o-y to US $ 380.1 Mn in January 2024 compared to January 2023. Additionally, exports of Apparel & Textile to USA, UK and EU Region decreased by 10.16%, 17.8% and 9.54% respectively in January 2024 compared to January 2023.
Similarly, export earnings from Spices and Essential Oils decreased by 14.94 % to US$ 29.33 Mn in the month of January 2024 compared to month of January 2023 mainly due to the poor performance in export of Cloves (-94.13%). Clove exports to India decreased by nearly 100% in January 2024 compared to January 2023.
In addition, export earnings from the Electrical & Electronics Components decreased by 18.37 % y-o-y to US$ 31.24 Mn in January 2024 with poor performance in exports of Insulated Wires and Cables (-3.24%), Electrical Transformers (-1.23 %) and Other Electrical & Electronic products (-36.67%).
Export earnings of Coconut fiber-based products decreased by 5.33 % in January 2024 compared to January 2023.
Furthermore, the total export earnings from Diamonds, Gems & Jewellery declined by 29.09 % y-o-y to US$ 32.98 million in January 2024. Export earnings from all three sub-sectors experienced decreases in January 2024: Diamonds (-23.23%), Gems (-33.56%), and Jewellery (-33.79%). Specifically, exports of Gems to the USA decreased by 53.03%, while exports of Diamonds to Israel decreased by 64.8%.
Export earnings of Boat building decreased by 14.29% to US$ 0.06 Mn in January 2024 compared to January 2023.
Table 1 shows the comparison of Merchandise export performance during the month of January 2024 compared to January 2023.
Sri Lanka’s Export Performance in Major Markets
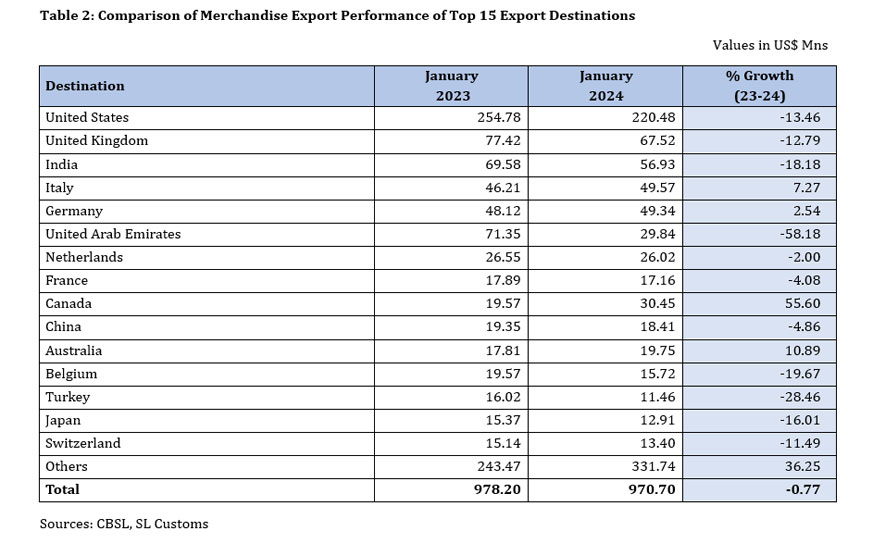
Among the top 15 export markets of Sri Lanka, Italy, Germany and Canada have shown positive growth in January 2024 compared to January 2023.
The United States of America continued as a key export destination for Sri Lanka, absorbing 23% of Sri Lanka’s merchandise exports in 2024. Exports to United States of America, Sri Lanka’s single largest export destination, decreased by 13.46 % to US$ 220.48 Mn in January 2024 compared to January 2023.
Additionally, exports to the United Kingdom decreased by 12.79% to US$ 67.52 Mn in January 2024 compared to the corresponding month in 2023.
Table 2 shows the comparison of Merchandise export performance of top 15 export markets during the month of January 2024 compared to January 2023.
Exports to FTA Partners (India & Pakistan)
In January 2024, exports to India & Pakistan constituted 6.5% of the total merchandise exports, experienced a notable 16.76 % decrease, reaching US$ 62.03 Mn, compared to January 2023. Furthermore, Exports to India decreased by 18.18 % US$ 56.93 Mn in January 2024 while exports to Pakistan increased by 3.24 % respectively during the month of January 2024 compared to January 2023.
The decline in exports to India was driven by lower exports of Animal feed (-52.21%) and positive performance of Pakistan was driven by increased exports of textiles, Article o stones, Chemical and Base Metal products.
Sri Lanka’s Export Performance in Regions
Table 3 shows the comparison of region wise exports during the month of January 2024 compared January 2023.
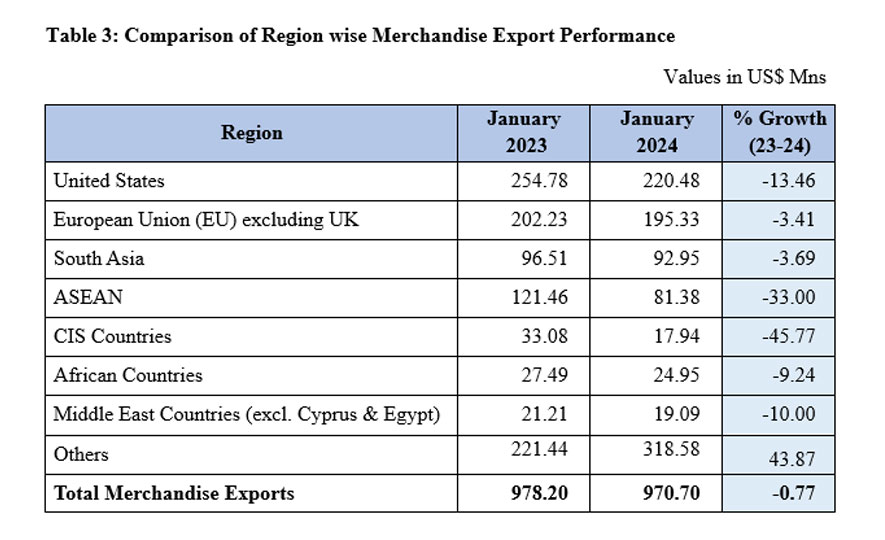
Exports to the European Union (EU) which accounts for 24% of Sri Lanka’s exports during the month of January 2024 decreased by 3.41 % y-o-y to US$ 195.33 Mn.
Exports to the top five EU markets were recoded as; Italy US$ 49.57 Mn (increased by 7.27 %), Germany US$ 49.34 Mn (increased by 2.54 %), Netherlands US$ 26.02 Mn (decreased by 2.0 %), France US$ 17.16 Mn. (decreased by 4.08 %) and Belgium US$ 15.72 Mn (decreased by 19.67 %) during the month of 2024 in comparison to the corresponding month in 2023.
Policy & Strategic Planning Division - 05.03.2024


