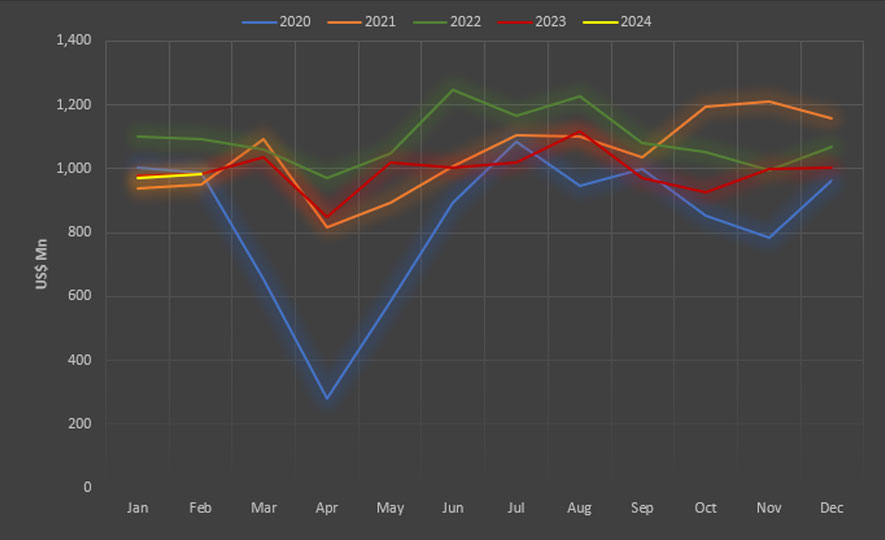
The merchandise export performance in February 2024 amounted to US$ 983.7 million, recorded a modest increase of 0.17 % compared to February 2023. Furthermore, export performance in February 2024 increased by 1.3% compared to the preceding month, January 2024.
Compared to February 2023, agricultural exports shown a significant increase of 11.82 %, reaching US$ 255.76 million in February 2024. However, industrial exports experienced a decline of 3.36 % during the same period, dropping to US$ 727.94 million.
Sources: Central Bank of Sri Lanka, Sri Lanka Customs
Major Exports in February 2024
a) Products with Positive Growth (Increases)
Export earnings from tea which made up 12% of merchandise exports, increased by 22.16 % y-o-y to US$ 127.74 Mn in February 2024 compared to February 2023. This increase is mainly due to the strong performance in the export of Bulk Tea and Tea packets, increased by 52.31 % and 2.56% respectively.
Furthermore, volume of tea exports increased by 20.27 % in February 2024 compared to February 2023. Additionally, Tea exports to UAE, Russia, Iraq and Iran markets, increased by 91.02%, 36.21%, 31.84 % and 359.07% respectively.
Moreover, Export earnings from Rubber and Rubber Finished products have increased by 15.87 % y-o-y to US$ 88.73 Mn in February 2024, with the strong performance in exports of Pneumatic & Retreated Rubber Tyres & Tubes (17.16%).
On monthly analysis, export earnings of Coconut based products increased by 25.17 % in February 2024 compared to February 2023. Moreover, export earnings of Coconut kernel products, Coconut fiber products and Coconut shell products increased by 20.27 %, 44.28% and 13.55 % respectively in February 2024 compared to February 2023.
Export earnings from Desiccated Coconut, Coconut Milk powder, Coconut Cream and Liquid Coconut Milk which are categorized under the Coconut kernel products increased by 32.27 %, 41.98 %, 18.96% and 36.36 % respectively in February 2024 compared to February 2023.
Being the largest contributor to Coconut based sector, Coco Peat, Fiber Pith & Moulded products which are categorized under the Coconut fibre products, increased by 52.89 % to US$ 16.13 Mn in February 2024 in comparison to February 2023.
Earnings from Activated Carbon, which is categorized under the Coconut shell products increased by 11.25 % to US$ 11.97 Mn in February 2024 compared to February 2023.
Export earnings from Seafood increased by 3.5 % to US$ 20.69 Mn in February 2024 compared to February 2023.This increase was mainly due to the strong performance in export of Fresh fish (3.36 %) and Shrimps (47.26 %).
Export earnings from Food & Beverages have increased by 36.77 % y-o-y to US$ 43.0 Million in February 2024, with the positive performance in exports of Processed food (31.88 %).
Furthermore, the total export earnings from Diamonds, Gems & Jewellery increased by 66.56 % y-o-y to US$ 37.61 million in February 2024. Except Jewellery (-49.14%), Export earnings from Diamonds and Gems experienced substantial increases, by 110.66% and 40.55% respectively in February 2024.
b) Products with Negative Growth (Decreases)
Export earnings from Apparel & Textile decreased by 2.06 % y-o-y to US $ 421.31 Mn in February 2024 compared to February 2023.
Similarly, export earnings from Spices and Essential Oils decreased by 33.32 % to US$ 22.99 Mn in the month of February 2024 compared to month of February 2023 mainly due to the poor performance in export of Cloves (-85.82%). Clove exports to India decreased by nearly 100% in February 2024 compared to February 2023.
Furthermore, export earnings from Ornamental fish decreased by 18.0 % to US$ 1.64 Mn in February 2024 compared to February 2023.
Additionally, export earnings from the Electrical & Electronics Components decreased by 18.25% y-o-y to US$ 35.16 Mn in February 2024 with poor performance in exports of Insulated Wires and Cables (-2.1%), Electrical Transformers (-34.47%) and Other Electrical & Electronic products (-31.11%).
Export earnings of Boat building decreased by 93.94 % to US$ 0.02 Mn in February 2024 compared to February 2023.
Exports during the period of January –February 2024
Cumulative merchandise exports during the period of January to February 2024, decreased by 0.30 % to US$ 1,954.39 Million compared to the corresponding period in 2023.
a) Products with Positive Growth (Increases)
Earnings from export of Tea, Rubber products, Coconut products and Food & Beverages increased by 12.63 %, 11.81 %, 21.21 % and 20.53 % respectively during the period of January – February 2024 compared, in comparison to the corresponding period of 2023.
Earnings from export of Tea increased y-o-y by 12.63 % to US$ 229.92 Mn in the period of January to February 2024. This increase was mainly due to the strong performance in export of Bulk Tea (30.0 %).
In addition, export earnings from Rubber & Rubber finished products increased by 11.81 % to US$ 170.46 Mn in January – February 2024 compared to the same period in 2023 attributed to increased exports of Industrial & Surgical Gloves of Rubber (11.14%) and Pneumatic & Retreated Rubber Tyres & Tubes (17.38%).
Export earnings of Coconut & Coconut based products increased by 25.17 % to US$ 124.51 Mn during January – February 2024 compared to the last year. Earnings from all the major categories of Coconut based products increased in the period of January – February 2024 compared with the corresponding period of 2023 due to the strong performance in export of Coconut Oil (13.09 %), Desiccated Coconut (33.68 %), Coconut Milk Powder (34.5 %), Coconut Cream (27.04 %), Liquid Coconut Milk (25.91 %), Cocopeat (26.81 %) and Activated Carbon (11.25 %).
Further, export earnings from Seafood increased by 6.74 % to US$ 43.69 Mn during the period of January to February 2024 compared to year 2023 due to the strong performance in Fresh Fish (18.47 %), Shrimps (46.13 %) and Crabs (17.37 %).
b) Products with Negative Growth (Decreases)
Earnings from export of Apparel & Textile have decreased by 6.08 % to US$ 801.42 Mn during the period of January to February 2024 compared to the same period in 2023. Further, earnings from export of Apparel declined by 5.14 % and export of Textiles declined by 15.85 % in January to February 2024.
In addition, export earnings from Spices and Essential Oils decreased y-o-y by 24.15 % to US$ 52.32 Mn in the period of January to February 2024. This decrease was due to the poor performance in exports of Cloves (90.21 %).
Meanwhile earnings from export of Electrical and Electronic Components (EEC) decreased by 18.32 % to US$ 66.4 Mn in the period of January to February 2024 compared to the corresponding period of 2023. This decrease was due to the poor performance in exports of Other Electrical & Electronic Products (33.84 %).
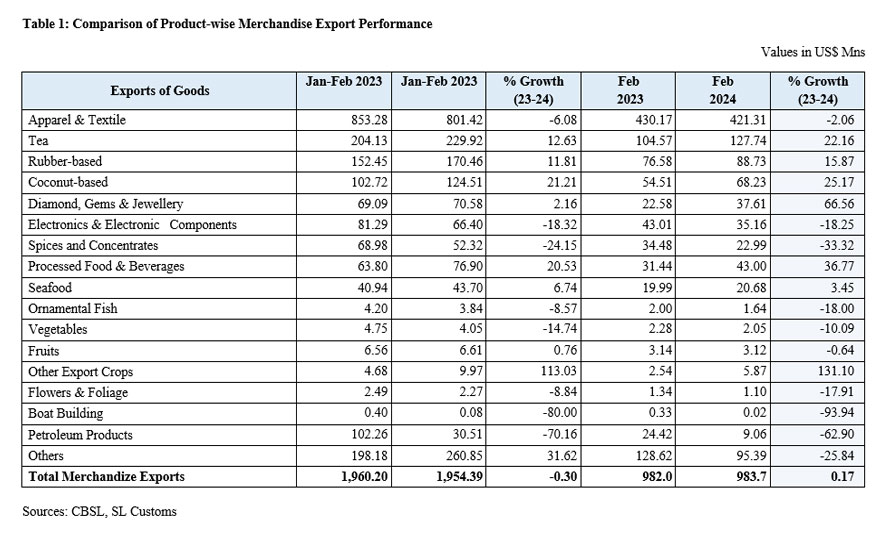
Table 1 shows the comparison of Merchandise export performance during the month of February 2024 and the period of January to February 2024 compared to 2023.
Sri Lanka’s Export Performance in Major Markets
Among the top 15 export markets of Sri Lanka, UK, Germany, Netherlands and France have shown positive growth in both February 2024 and the cumulative period of January to February 2024 compared to the corresponding periods in 2023.
United States of America, Sri Lanka’s single largest export destination, which absorbs 23% of Sri Lanka’s merchandise exports, increased by 8.02 % to US$ 249.6 Mn in February 2024 compared to February 2023. However, exports to America in the cumulative period of January to February 2024 decreased by 3.24% to US$ 470.07 Mn compared to the corresponding periods in 2023.
Additionally, exports to the United Kingdom increased by 20.49 % to US$ 82.93 Mn in February 2024 compared to the corresponding month in 2023. Meanwhile, exports to the United Kingdom increased by 2.87 % to US$ 150.45 Mn in cumulative period of January to February 2024 compared to the corresponding period in 2023
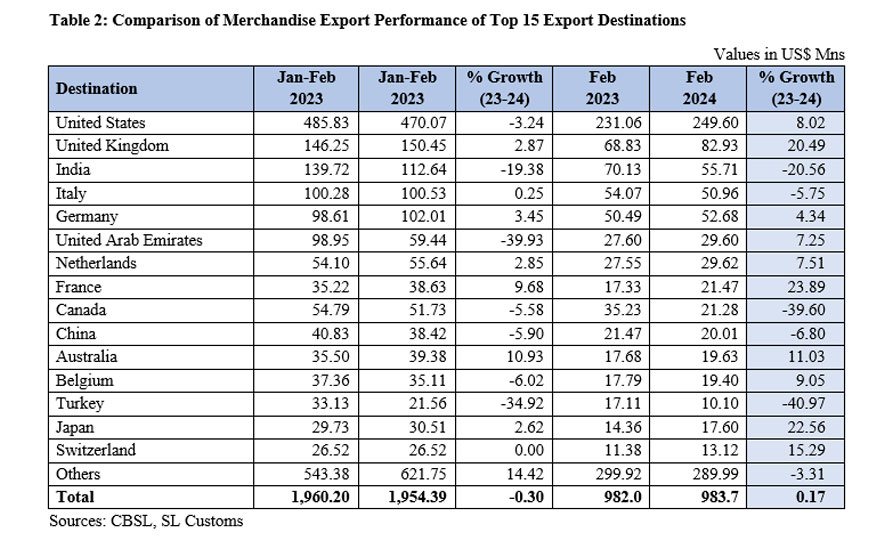
Table 2 shows the comparison of Merchandise export performance of top 15 export markets during the month of February 2024 and the period of January to February 2024 compared to 2023.
Exports to FTA Partners (India & Pakistan)
a) February 2024
In February 2024, exports to India & Pakistan constituted 6.5% of the total merchandise exports, experienced a notable 18.18 % decrease to reach US$ 61.28 Mn, compared to February 2023. Further, exports to India recorded a decrease of 20.56 % whereas exports to Pakistan increased by 17.02 % in February 2024 compared to February 2023.
The negative performance of India was driven by lower exports of Cloves (-96.79%) and Petroleum oil (-92.7%), while Pakistan's positive performance was led by increased exports of Other Textile Articles.
b) January - December 2023
Exports to India & Pakistan accounted for 7.2% of total merchandise exports decreased by 3.21 % to US$ 904.39 Mn during the period of January to December 2023 compared to the corresponding period of previous year.
Exports to India and Pakistan decreased by 2.95 % and 6.06 % respectively during the period of January to December 2023 when compared with the corresponding period in 2023.
The negative export performance of India was driven by lower export of Animal feed (12.92 %), while Pakistan's negative performance was led by decreased export of Sheet rubber and Other article of stones.
Sri Lanka’s Export Performance in Regions
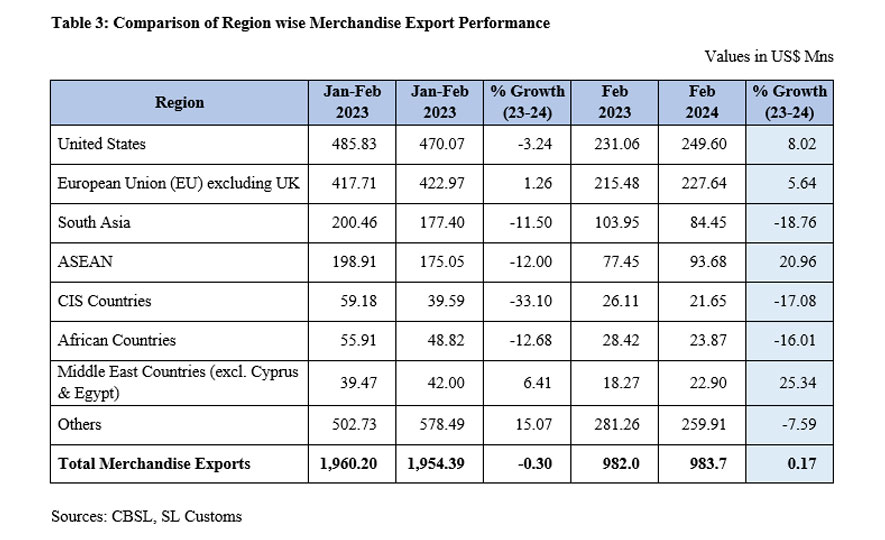
Table 3 shows the comparison of region wise exports during the month of February 2024 and the period of January to February 2024 compared to 2023.
Exports to the European Union (EU) which accounts for 24% of Sri Lanka’s exports during both February 2024 and the cumulative period of January to February 2024 increased respectively by 5.64 % and 1.26%.
Exports to the top five EU markets were recoded as; Germany US$ 102.01 Mn (increased by 3.45 %), Italy US$ 100.53 Mn (increased by 0.25 %), Netherlands US$ 55.64 Mn (increased by 2.85 %), France US$ 38.63 Mn. (increased by 9.68 %) and Belgium US$ 35.11Mn (decreased by 6.02 %) during the cumulative period of January to February 2024 in comparison to the corresponding period in 2023.
Policy & Strategic Planning Division - 22.03.2024


