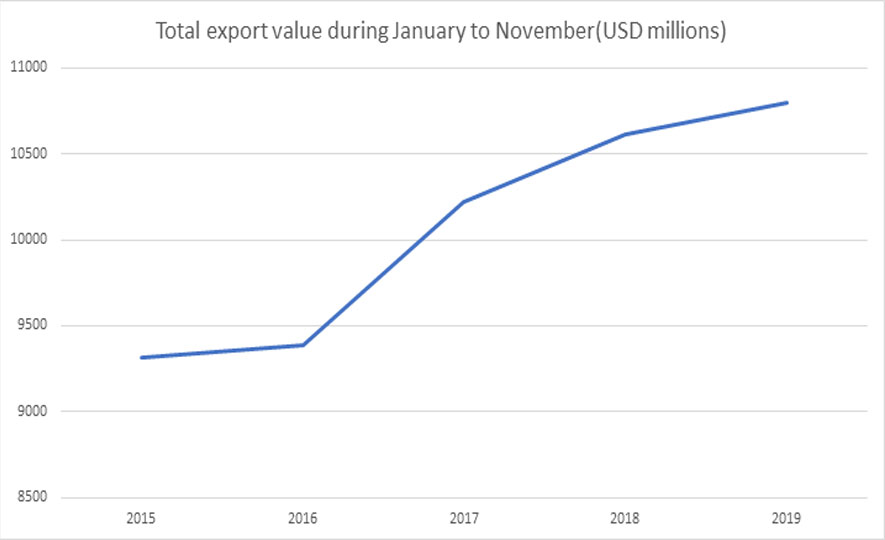
The total value of merchandise exports of the country for first 11 months of 2019 was recorded at US$ 10.7 Bn according to the provisional statistics. This is a US$ 180 Mn increase in value and a 1.7% growth when compared to the similar period of the previous year. Total merchandise exports recorded for the month of November 2019, was US$ 950 Mn while it was 980 US$ Mn in 2018.
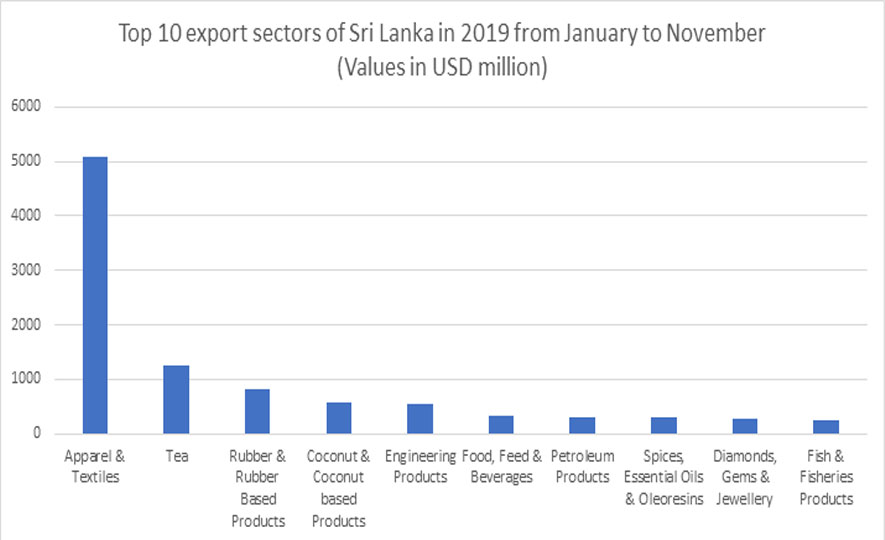
The apparel & textiles sector contributed 47% of the total value of merchandise exports and remained as the largest contributor to total exports followed by, Tea (11%), Rubber and Rubber based products (7.5%), Coconut and Coconut based products and engineering products (5%) while shares of all other sectors recorded less than 5% during the period under review.
Only the Apparel (US$ 5,096 Mn), and Tea (US$ 1,241 Mn), sectors recorded over one billion worth of exports, maintaining its usual patterns.
Export values from other sectors are, Rubber & Rubber based products US$ 815 Mn, Coconut & Coconut Based products US$ 570Mn, Engineering Products US$ 550 Mn, Petroleum Products US$ 311 Mn, Food & Beverages US$ 333Mn, Spices & Essential Oils US$ 292 Mn, Gems & Jewellery including Diamond US$ 288 Mn and Fish & Fisheries products US$ 252 Mn.
The top ten markets for Sri Lanka’s merchandise exports for the period under review were United States of America (2.856 US$ Mn), United Kingdom (925 US$ Mn), India (703 US$ Mn), Germany (594 US$ Mn), Italy (490 US$ Mn), Belgium (323 US Mn), Netherlands (270 US$ Mn), Japan (US$ 263 Mn), UAE (256 Mn), and Canada (220 US$ Mn).
SRI LANKA EXPORT DEVELOPMENT BOARD
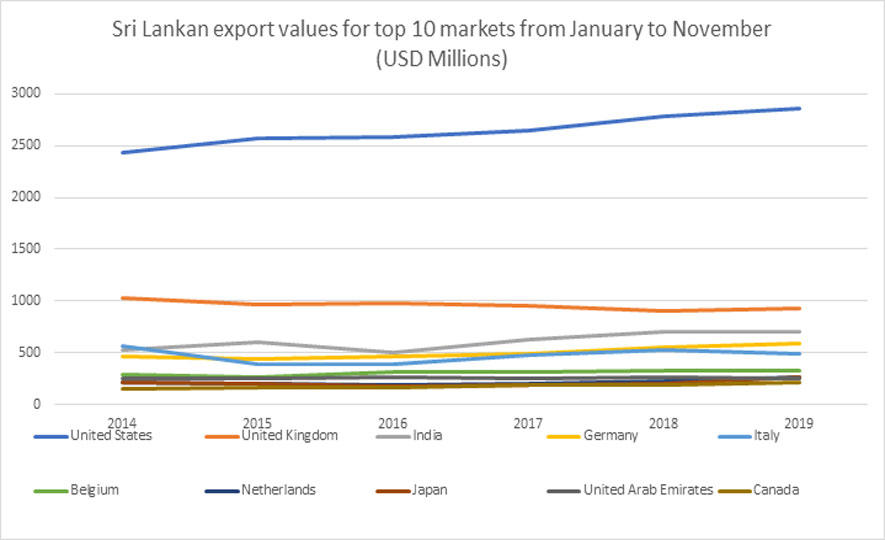
USA the only market with a billion figure, which currently records a 26% of market share has showed a continuous growth over the last 6 years. The other top markets that displayed positive growth were United Kingdom 3%, Germany 7%, Netherlands 18%, Japan 27%, and Canada 16%. Germany and Canada too are growing markets for last five years except in one instance during the period.
Exports to four markets recorded a drop in their respective contributions. They are, India (-0.5%), Italy (-7.6%), Belgium (-1.5%) and UAE (-2.3%).
Main exports to USA from January- November 2019 were Apparel (US$ 2124 Mn), Rubber Finished Products (US$ 250 Mn), Coconut shell & Kernal Products (US$ 85 Mn), Edible Fish Products (US$ 33 Mn), Electrical & Electronic Products (US$ 31 Mn) and Nails, Screws (US$ 29 Mn) etc.
The main products to United Kingdom, Canada, and Germany are Apparel & Apparel related items, Rubber Finished Products and Electrical &Electronic products, and Coconut Kernal products.
Products such as Apparel, Tea, Manufactures Products, Beverages, Fruits and Vegetables were the prominent products to UAE.
Exports to China recorded values of US$ 209 Mn prominent items being Apparel, Tea in Bulk and Edible Fish Products, while Pakistan recorded US$ 72 Mn exports during the January to November 2019.


